Monitoring Infiniband Network Utilization on CentOS 7, with some bonus Zabbix bits
This is way out of date now
The information in this post is so out-dated that I wonder why I'm keeping it around. I guess I'm a digital hoarder...
I've recently had the time and the drive to dive a little deeper into Infiniband...which is a bit of an understatement considering my understanding prior to going down the 'how do I monitor this' rabbit hole consisted of compiling OpenMPI with Infiniband Support.
Rather than bore all of you with the inconsequential fluff - I'll just get down to the 'here is how I did it' details.
Assumptions
You already have infiniband enabled hosts and a subnet manager running.
You have installed infiniband support for Red Hat/CentOS repos and NOT directly from Mellanox/Intel/INSERT VENDOR HERE.
Tools like ibdiagnet show expected output.
You are familiar with Zabbix Low Level Discovery.
All that said, maybe in another post I'll go over how I got that far...but for now I'm gonna be lazy (running theme for me.)
Caveats
Most of my test gear involved Mellanox cards, so this information may not be entirely accurate if tested against another vendor's cards.
The Zabbix bits are provided as-is and may not work for you.
As always, use documents you find on blogs at your own risk. This worked for me. It may not work for you.
Getting the Information
There will be some files in /sys/class/infiniband full of juicy juicy
information. The ones we are currently concerned with / the ones I chose to
monitor are:
### Counters
/sys/class/infiniband/${DEVICE}/ports/${PORT}/counters/port_xmit_packets
/sys/class/infiniband/${DEVICE}/ports/${PORT}/counters/port_xmit_data
/sys/class/infiniband/${DEVICE}/ports/${PORT}/counters/port_rcv_packets
/sys/class/infiniband/${DEVICE}/ports/${PORT}/counters/port_rcv_data

### Info
/sys/class/infiniband/${DEVICE}/ports/${PORT}/rate
/sys/class/infiniband/${DEVICE}/ports/${PORT}/state
/sys/class/infiniband/${DEVICE}/ports/${PORT}/phys_state
For example, one of my hosts with a Mellanox card that has a single port would
be /sys/class/infiniband/mlx5_0/ports/1/ . In this case, ${DEVICE} is
"mlx5_0" and ${PORT} is "1".
After a lot of knowledge base article reading[1], source code reading[2], and general DuckDuckGo-Fu, I was able to determine that the counters for 'xmit_data' and 'rcv_data' are in octets divided by 4, at least for the Mellanox cards. This is important data when you go to graph this information.
Also through the aforementioned searching/reading, I determined the following values for 'state' and 'phys_state', again - at least for the Mellanox cards[3]:
| State (state) | Meaning |
|---|---|
| 0 | ??? |
| 1 | Down |
| 2 | Initializing |
| 3 | Armed |
| 4 | Active |
| Physical State (phys_state) | Meaning |
|---|---|
| 0 | No state change |
| 1 | Sleep |
| 2 | Polling |
| 3 | Disabled |
| 4 | PortConfigurationTraining |
| 5 | LinkUp |
| 6 | LinkErrorRecovery |
| 7 | PhyTest |
Zabbix Bits
I've got a few hosts with a few cards in them...so I didn't want to create an item for each of them in Zabbix. Remember...I'm lazy.
This is where Zabbix Low Level Discovery came in handy. With low level discovery, I can have Zabbix discover each device.
First, the zabbix user parameter I used:
UserParameter=infiniband.discovery, if [[ -d /sys/class/infiniband ]]; then echo -n '{"data":['; for dev in /sys/class/infiniband/*; do DEVICE=$(basename $dev); for port in /sys/class/infiniband/${DEVICE}/ports/*; do PORT=$(basename $port); echo -n "{\"{#HCA}\": \"${DEVICE}:${PORT}\"},"; done ; done | sed -e 's:\},$:\}:'; echo -n ']}'; fi
The same logic in a bit more readable format:
## only fire if /sys/class/infiniband exists
if [[ -d /sys/class/infiniband ]]; then
  ## open the json output
  echo -n '{"data":['
  ## for each device
  for dev in /sys/class/infiniband/*; do
    DEVICE=$(basename $dev)
    ## For each port in device
    for port in /sys/class/infiniband/${DEVICE}/ports/*; do
      PORT=$(basename $port)
      ## echo the json
      echo -n "{\"{#HCA}\": \"${DEVICE}:${PORT}\"},"
    done
  ## trim off the last comma
  done | sed -e 's:\},$:\}:'
  ## close the json
  echo -n ']}'
fi
Example Output:
## Raw
{"data":[{"{#HCA}": "mlx5_0:1"},{"{#HCA}": "mlx5_1:1"},{"{#HCA}": "mlx5_2:1"},{"{#HCA}": "mlx5_3:1"}]}

## Pretty Printed
{
  "data": [
    {
      "{#HCA}": "mlx5_0:1"
    },
    {
      "{#HCA}": "mlx5_1:1"
    },
    {
      "{#HCA}": "mlx5_2:1"
    },
    {
      "{#HCA}": "mlx5_3:1"
    }
  ]
}
Along with the LLD rules, I also added some UserParameter configuration scripts
to gather the information on the host. These expect the first argument to be
in the format "device:port", then using cut it splits the input and builds
the path to the information that will be monitored.
Counters
UserParameter=infiniband.port_xmit_packets[*], DEVICE="$(echo $1 | cut -f1 -d:)"; PORT="$(echo $1 | cut -f2 -d:)"; cat /sys/class/infiniband/${DEVICE}/ports/${PORT}/counters/port_xmit_packets
UserParameter=infiniband.port_xmit_data[*], DEVICE="$(echo $1 | cut -f1 -d:)"; PORT="$(echo $1 | cut -f2 -d:)"; cat /sys/class/infiniband/${DEVICE}/ports/${PORT}/counters/port_xmit_data
UserParameter=infiniband.port_rcv_packets[*], DEVICE="$(echo $1 | cut -f1 -d:)"; PORT="$(echo $1 | cut -f2 -d:)"; cat /sys/class/infiniband/${DEVICE}/ports/${PORT}/counters/port_rcv_packets
UserParameter=infiniband.port_rcv_data[*], DEVICE="$(echo $1 | cut -f1 -d:)"; PORT="$(echo $1 | cut -f2 -d:)"; cat /sys/class/infiniband/${DEVICE}/ports/${PORT}/counters/port_rcv_data
Info
UserParameter=infiniband.rate[*], DEVICE="$(echo $1 | cut -f1 -d:)"; PORT="$(echo $1 | cut -f2 -d:)"; cat /sys/class/infiniband/${DEVICE}/ports/${PORT}/rate
UserParameter=infiniband.state[*], DEVICE="$(echo $1 | cut -f1 -d:)"; PORT="$(echo $1 | cut -f2 -d:)"; cat /sys/class/infiniband/${DEVICE}/ports/${PORT}/state | cut -f1 -d:
UserParameter=infiniband.phys_state[*], DEVICE="$(echo $1 | cut -f1 -d:)"; PORT="$(echo $1 | cut -f2 -d:)"; cat /sys/class/infiniband/${DEVICE}/ports/${PORT}/phys_state | cut -f1 -d:
A git repository with the above Zabbix bits, plus a template for Zabbix can be found on this fancy new GitLab thang.
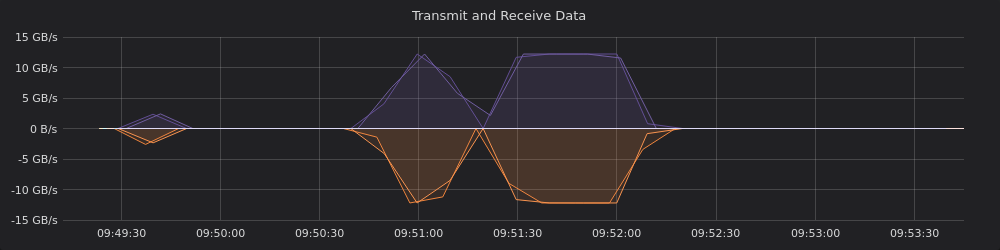
Lovely Pictures
Eyeballed the graph while doing a sustained qperf test on 2 of my hosts.
Assuming I understand any of this (yikes) I believe I've got things set up
correctly. ~12GB/s transmit plus ~12GB/s receive equals ~24GB/s bi-directional
bandwidth (as reported by the test rc_bi_bw).